Introduction
In Part 1, I built a security-gated CI/CD pipeline. In Part 2, I brought my infrastructure under Terraform — every DNS record and cloud resource defined in code, deployed through a GitOps pipeline. Both of those were about how things get delivered and provisioned.
Part 3 is about where things actually run.
Up to this point, every service in my homelab ran as a Docker container on a single machine. If that machine rebooted, everything went down with it. If I closed the laptop lid by accident, my whole stack disappeared until I opened it again. There was no redundancy. One machine, one point of failure.
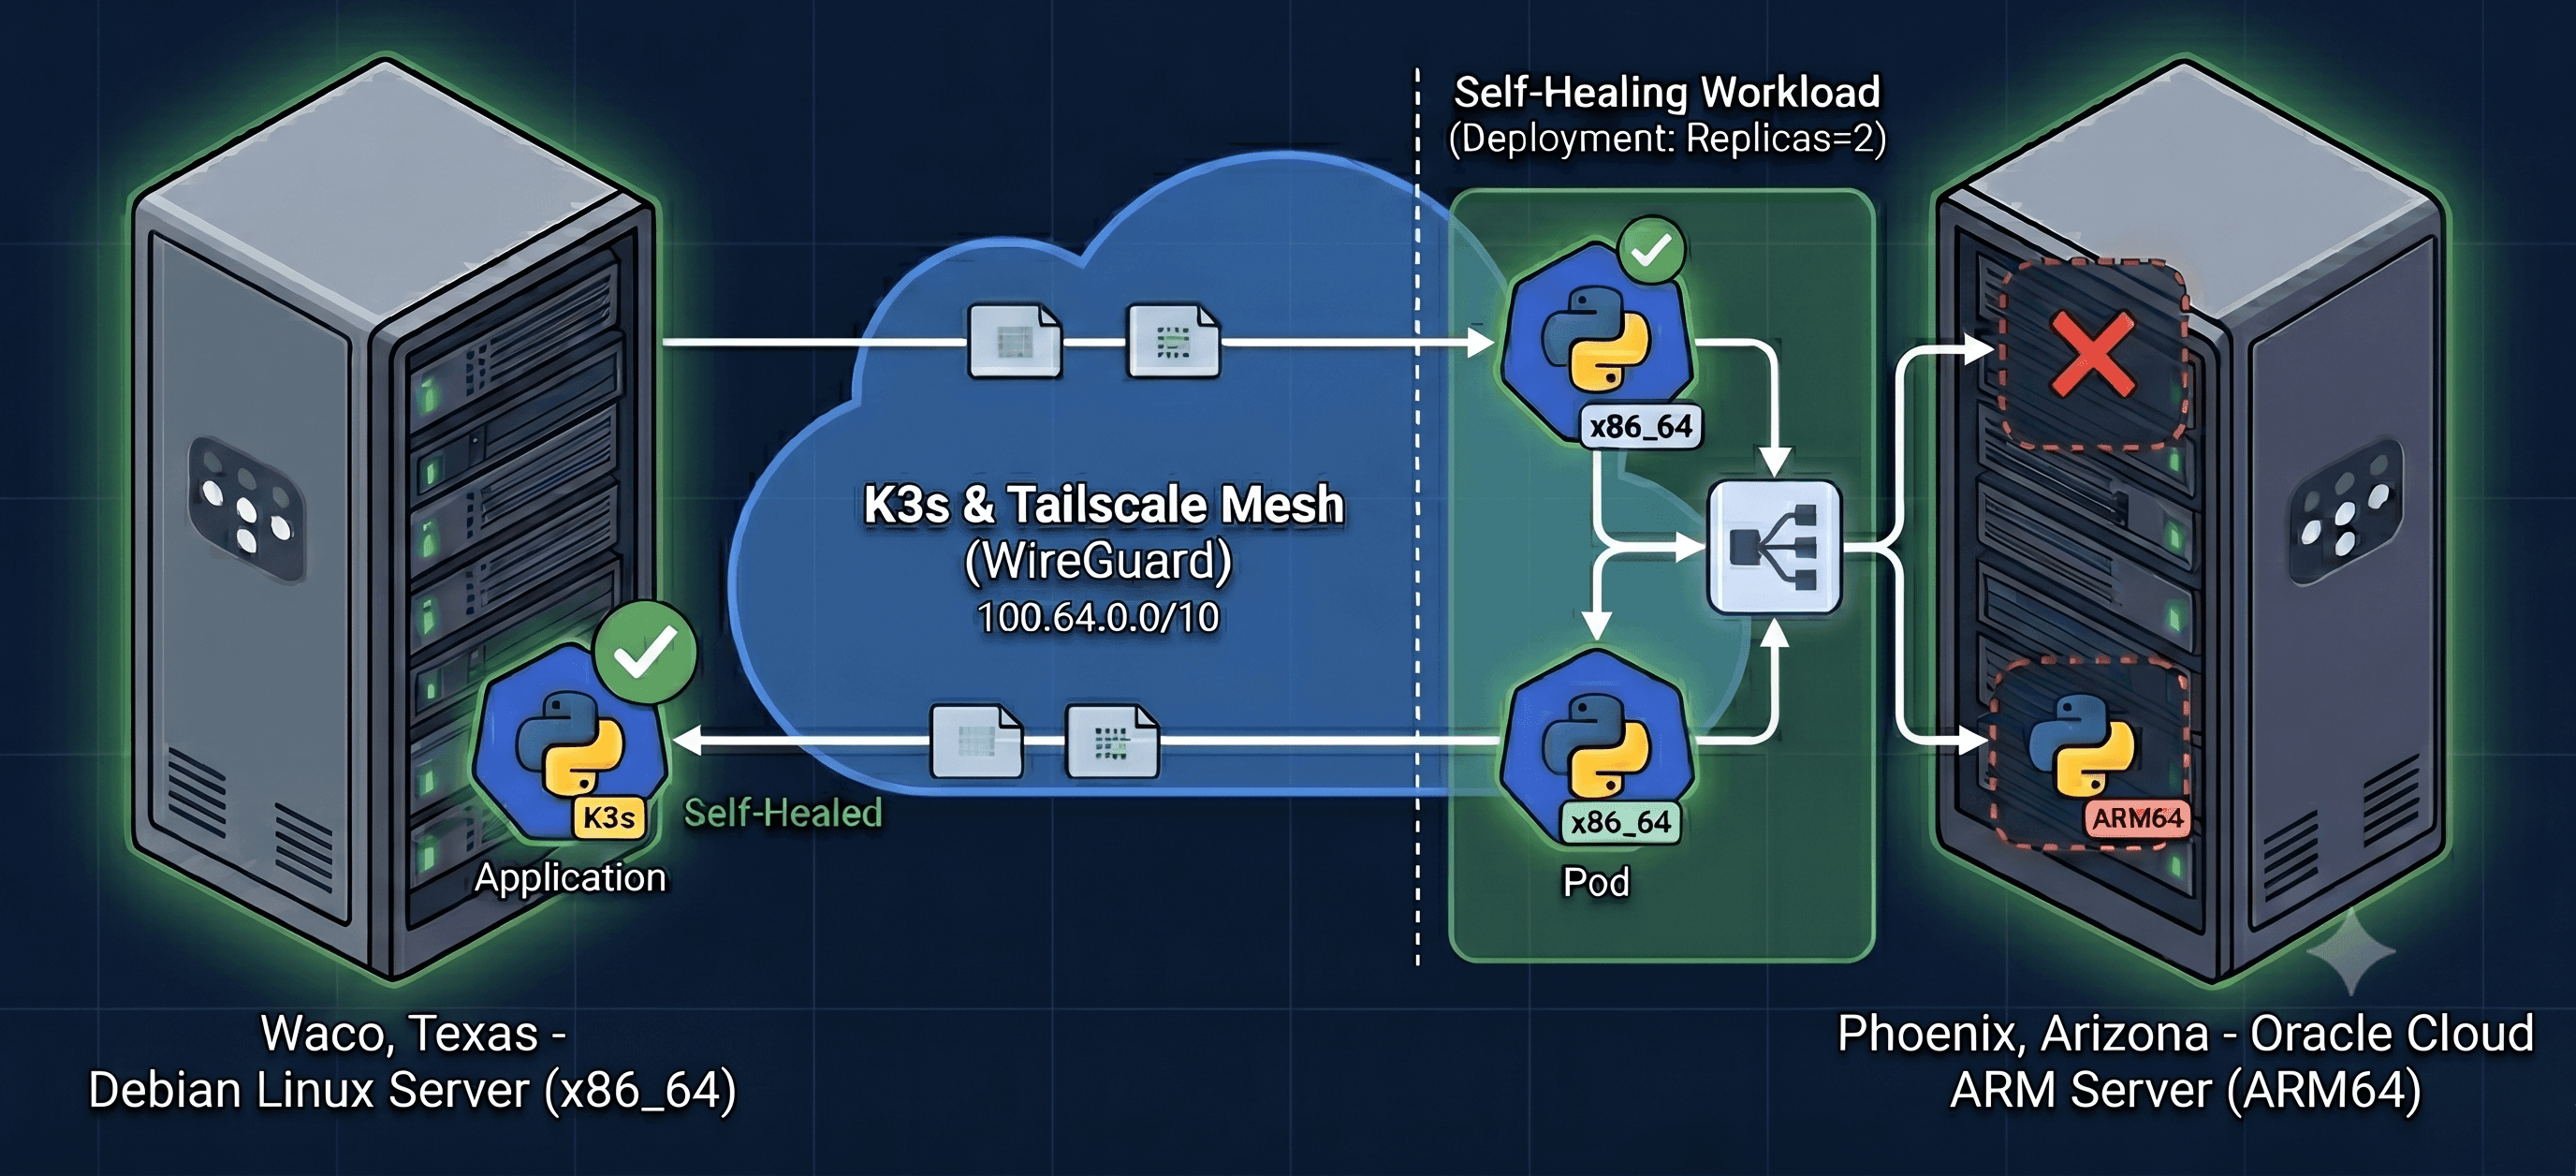
The plan for Part 3 was to change that — to take two always-on machines, a Debian laptop in one location and an ARM server in a cloud region a thousand-plus miles away, and join them into a single Kubernetes cluster. Not because a homelab needs Kubernetes (it does not), but because Kubernetes is the layer where “keep this running even if a machine dies” stops being something I do by hand and becomes something the system does for me.
This was the part of the roadmap I was most intimidated by. Kubernetes has a reputation for being complicated, and the multi-region, mixed-architecture setup I wanted only adds to that. It did not go smoothly. I hit a networking bug that took real debugging, a CPU-architecture mismatch that crashed half my pods, and somewhere in the middle I discovered a flaw in my monitoring that had been there for months without me noticing.
But it is done. I have a real two-node cluster spanning two regions, running a workload that survives either node going offline. This post is both the story and a step-by-step guide — the commands and manifests are all here, genericized so you can adapt them to your own two machines.
A note on placeholders: throughout this post I use
<CONTROL_PLANE_IP>and<WORKER_IP>for the two nodes’ private mesh addresses, and<NODE_TOKEN>for the cluster join token. Substitute your own values. I never put real IPs, hostnames, or tokens in a public writeup — and neither should you.
See it live
- The Lab — live infrastructure status and build progress tracker
- Architecture diagram — full infrastructure map spanning three regions
What is Kubernetes, really?
Before the build, a plain-language version of what Kubernetes actually does, because the marketing version (“it scales web apps!”) misses the point.
Kubernetes is a system that keeps your desired state true. You write down what you want — “two copies of this app should always be running” — and Kubernetes continuously works to make reality match that description. A container crashes? It starts a new one. A whole machine dies? It moves the work to a surviving machine. You want to update the app? It swaps the copies out one at a time so nothing goes down.
The mental model that made it click for me: imagine a building manager with an instruction sheet that says “there should always be three guards at the front desk.” If one goes home sick, the manager calls in a replacement. You do not micromanage — you declare the desired state, and the manager reconciles reality against it, continuously. Kubernetes is that manager, for your containers.
The “scaling for demand” thing everyone mentions is just one instruction you can add (“if CPU gets high, add more copies”). It is not the essence. The essence is the reconciliation loop: desired state versus actual state, corrected automatically, forever.
I am running K3s, which is a lightweight, fully certified Kubernetes distribution — the same Kubernetes API and behavior, packaged as a single small binary instead of the usual sprawl of components. On a resume it is fair to write “K3s (Kubernetes),” because it passes the same conformance tests the full distribution does.
Chapter 1: The Two Nodes
The cluster is built from two machines that could hardly be more different:
The control plane is an x86_64 Debian machine. This is the node that makes decisions: what runs where, what the desired state is, what needs reconciling.
The worker is an ARM64 cloud instance with 4 cores and 24GB of RAM, always on because it is a cloud VM rather than a laptop.
Two things about this pairing matter for the rest of the story. First, the two machines are in different regions on different networks — that is what makes the cluster genuinely resilient rather than just “two computers in one room.” Second, they have different CPU architectures — x86_64 versus ARM64 — which turns out to be a real problem I had to solve in Chapter 4.
Before installing anything, both machines need to be on the same private mesh network (the next chapter explains why), and you need kubectl on whichever machine you will run commands from. K3s bundles kubectl on the control plane automatically; to install a standalone copy elsewhere:
curl -LO "https://dl.k8s.io/release/$(curl -L -s https://dl.k8s.io/release/stable.txt)/bin/linux/amd64/kubectl"
chmod +x kubectl && sudo mv kubectl /usr/local/bin/
Prerequisites: The Mesh Network
This cluster is built on top of the Tailscale mesh I set up back in Part 2, so by the time I got to Kubernetes the network was already there. If you are starting fresh, the mesh is the one piece you need in place before anything else — the cluster cannot form without it.
The setup is genuinely short. On each machine that will join the cluster:
# Install Tailscale
curl -fsSL https://tailscale.com/install.sh | sh

# Bring it up and authenticate (opens a login URL)
sudo tailscale up
Then confirm each node can see the others, and note the 100.x mesh addresses they were assigned — those are the values that become <CONTROL_PLANE_IP> and <WORKER_IP> in the rest of this guide:
tailscale status
By default, every device in your tailnet can reach every other device, which is exactly what a Kubernetes cluster needs — the control plane and worker have to talk freely on the cluster ports. If you later lock down the tailnet with ACLs, remember to leave the nodes able to reach each other. (The deeper mesh topics — ACL policy, MagicDNS, and a memorable conflict between Tailscale and Android’s Private DNS — belong with my DNS writeup, not here. For the cluster, “all nodes can reach each other on the mesh” is all you need.)
One detail worth knowing up front: the mesh interface is named tailscale0. That name shows up in the next chapter as the interface K3s pins its networking to, and it is the single most important flag in the whole install.
Chapter 2: Joining the Nodes Over Tailscale
The two machines are not on the same physical network. One is behind a home router; the other is in a cloud data center. For Kubernetes nodes to form a cluster, they need to talk to each other on a stable, private network.
That is what Tailscale provides — a mesh VPN built on WireGuard that gives every device a stable address in the 100.64.0.0/10 range that works regardless of where the device physically sits. From Part 2, all my machines were already on this mesh. Each node’s mesh address is what I refer to as <CONTROL_PLANE_IP> and <WORKER_IP> below.
Install the control plane, pinned to its mesh IP and told to use the mesh interface for cluster networking:
curl -sfL https://get.k3s.io | sh -s - server \
  --node-ip=<CONTROL_PLANE_IP> \
  --flannel-iface=tailscale0 \
  --write-kubeconfig-mode=644 \
  --disable=traefik
That --flannel-iface=tailscale0 flag is the important one. Flannel is the component that handles pod-to-pod networking across nodes. By default it picks the machine’s primary network interface — which for these two machines would be their unrelated local networks that cannot reach each other. Forcing Flannel onto the mesh interface is what makes cross-region pod networking possible at all. (--disable=traefik is explained in Chapter 5.)
Get the join token from the control plane:
sudo cat /var/lib/rancher/k3s/server/node-token
Join the worker, pointing at the control plane’s mesh address and presenting that token, again pinned to its own mesh IP and interface:
curl -sfL https://get.k3s.io | \
  K3S_URL=https://<CONTROL_PLANE_IP>:6443 \
  K3S_TOKEN=<NODE_TOKEN> \
  sh -s - agent \
  --node-ip=<WORKER_IP> \
  --flannel-iface=tailscale0
Verify from the control plane:
kubectl get nodes -o wide
After the join, both nodes showed Ready. On paper, the cluster existed.
Chapter 3: The Networking Bug That Did Not Show Up Until I Tested It
“Both nodes Ready” is not the same as “both nodes can actually talk to each other.” I learned this the moment I tried to get a pod on one node to reach a pod on the other.
It failed. A pod on the control plane could not reach a pod on the worker, even though Kubernetes reported the cluster as healthy.
The cause took some digging. Flannel sets up an overlay network using a virtual interface called flannel.1 on each node, plus routes telling each node how to reach the other node’s pod IP range. On the control plane, that flannel.1 interface had not been created — Flannel had not finished wiring up the overlay against the mesh interface. You can check for it directly:
# On each node — the flannel.1 interface should exist
ip addr show flannel.1

# And each node should have a route to the OTHER node's pod CIDR
ip route | grep 10.42
On a healthy two-node K3s cluster, the control plane owns 10.42.0.0/24 and the worker owns 10.42.1.0/24, and each node has a route to the other’s range via flannel.1. Mine was missing that route because the interface had not come up.
The fix turned out to be a restart of the K3s service on the control plane, which forced Flannel to re-initialize:
sudo systemctl restart k3s
That created the missing flannel.1 interface and the route to the worker’s pod range. I confirmed it with a real cross-node test — exec into a pod on one node and curl a pod on the other:
kubectl exec -it <pod-on-control-plane> -- curl -s http://<pod-ip-on-worker>:<port>
After the restart, that call succeeded across the full distance between regions, and the overlay network was genuinely working.
The lesson here is one I keep relearning: a green status indicator means “the thing started,” not “the thing works.” You only find out it works by testing the actual behavior you care about — in this case, a real cross-node connection.
Chapter 4: The exec format error — When Half Your Pods Will Not Start
This is the chapter I would have found most intimidating before, and it ended up being the most satisfying to solve.
I built a small status-page application — a Python Flask app that checks whether my public services are up and displays the result. Here is the Dockerfile:
FROM python:3.11-slim
WORKDIR /app
COPY requirements.txt .
RUN pip install --no-cache-dir -r requirements.txt
COPY app.py .
EXPOSE 5000
CMD ["python", "app.py"]
I built it on the control plane, the way I have built every container image before:
docker build -t status-page:v1 .
I deployed it to the cluster asking for two copies. One copy started fine, on the control plane. The other copy, scheduled onto the ARM worker, crashed immediately and kept crashing. Checking the logs:
kubectl logs <crashing-pod-name>
# exec /usr/local/bin/python: exec format error
exec format error means the program was compiled for the wrong CPU architecture. I had built the image on my x86_64 control plane, so it contained x86_64 binaries. The worker is ARM64. Those binaries literally cannot run on an ARM processor — it is like handing someone instructions written in an alphabet they do not read.
This is a genuinely common problem the moment you mix architectures in a cluster, and the proper fix is a multi-architecture image — a single image that contains binaries for both architectures, where each node automatically pulls the variant it can run.
Docker’s buildx tool does this, but it needs emulation support to build ARM binaries on an x86 machine. Set up the builder and install QEMU emulation:
# Create a buildx builder that can target multiple platforms
docker buildx create --name multiarch --use

# Install QEMU emulation handlers so x86 can build ARM binaries
docker run --privileged --rm tonistiigi/binfmt --install all
Then rebuild targeting both platforms at once. Because this homelab has no container registry yet, I output to an OCI tar file instead of pushing:
docker buildx build \
  --platform linux/amd64,linux/arm64 \
  -t status-page:v1 \
  --output type=oci,dest=status-page-multiarch.tar .
This builds the image twice internally — once natively for x86_64 (fast) and once under ARM emulation (slower, because every instruction is being translated) — and packages both into a single artifact with a manifest that lets each node select the right one.
Then import the image into each node’s containerd. On the control plane:
sudo k3s ctr images import status-page-multiarch.tar
Copy the tar to the worker over the mesh and import it there too:
scp status-page-multiarch.tar <user>@<WORKER_IP>:~/
# then, on the worker:
sudo k3s ctr images import ~/status-page-multiarch.tar
After redeploying, both copies started cleanly — one on the x86_64 control plane, one on the ARM64 worker, from the same image. The architecture mismatch was gone.
One honest note: moving images by exporting to a tar and copying it to each node works, but it is a manual crutch. The proper solution is a container registry that both nodes pull from automatically, and that is on the list for a future phase. Doing it the manual way first taught me why a registry exists, which I do not regret.
Chapter 5: The Workload — Replicas, Probes, and Forcing One Pod Per Node
With the image working everywhere, I could write the actual Kubernetes configuration the way it is meant to be written. Here is the full deployment.yaml, then an explanation of the pieces that matter:
apiVersion: apps/v1
kind: Deployment
metadata:
  name: status-page
  labels:
    app: status-page
spec:
  replicas: 2
  selector:
    matchLabels:
      app: status-page
  template:
    metadata:
      labels:
        app: status-page
    spec:
      containers:
        - name: status-page
          image: status-page:v1
          imagePullPolicy: IfNotPresent
          ports:
            - containerPort: 5000
          livenessProbe:
            httpGet:
              path: /health
              port: 5000
            initialDelaySeconds: 10
            periodSeconds: 30
          readinessProbe:
            httpGet:
              path: /health
              port: 5000
            initialDelaySeconds: 5
            periodSeconds: 10
          resources:
            requests:
              memory: "64Mi"
              cpu: "50m"
            limits:
              memory: "128Mi"
              cpu: "200m"
      topologySpreadConstraints:
        - maxSkew: 1
          topologyKey: kubernetes.io/hostname
          whenUnsatisfiable: DoNotSchedule
          labelSelector:
            matchLabels:
              app: status-page
A few pieces are worth explaining because they are the difference between “a container that happens to run” and “a workload Kubernetes actively manages.”
replicas: 2 — the desired state says two copies should always exist. This is the foundation of the redundancy — if one dies, the other keeps serving while a replacement is created.
imagePullPolicy: IfNotPresent — critical when you import images manually instead of using a registry. It tells Kubernetes “use the local image if it exists, do not try to pull from a registry.” Without this, it would try to fetch from Docker Hub and fail.
Health probes. The app exposes a /health endpoint. The liveness probe asks “is this pod alive? if not, restart it.” The readiness probe asks “should this pod receive traffic right now? if not, stop routing to it but leave it alone.” That distinction — restart versus stop-sending-traffic — is the heart of automated health management.
Resource limits. Each pod is guaranteed a small amount of CPU and memory (requests) and capped at a larger amount (limits). If a pod exceeds its memory ceiling, Kubernetes kills and restarts it, so one misbehaving pod cannot take down the whole node.
Topology spread. This is the piece that delivers genuine geographic redundancy. maxSkew: 1 with topologyKey: kubernetes.io/hostname tells Kubernetes “do not let one node hold more of these pods than another.” With two replicas and two nodes, that forces exactly one pod onto each node. Without it, Kubernetes might place both copies on the same node — and then a single machine failure would still take the whole app down. The constraint is what turns “two copies” into “two copies in two regions.”
The service.yaml puts a stable address in front of both pods and load-balances across them:
apiVersion: v1
kind: Service
metadata:
  name: status-page
  labels:
    app: status-page
spec:
  type: NodePort
  selector:
    app: status-page
  ports:
    - port: 80
      targetPort: 5000
      nodePort: 30080
type: NodePort opens a fixed port (30080) on every node, which is the simplest way to expose a service in a homelab without a cloud load balancer. The selector is the magic link — the Service routes to any pod labeled app: status-page, the same label the Deployment applies. Service and Deployment connect through matching labels, not direct references.
This is also why I disabled Traefik back in Chapter 2 with --disable=traefik. Traefik is K3s’s bundled ingress controller, and it claims ports 80 and 443 on every node. I already use Cloudflare Tunnels for all public ingress, so Traefik was redundant — and worse, on the worker it was intercepting port 80 traffic meant for another service. Disabling it removed a conflict I did not need.
Apply both manifests:
kubectl apply -f deployment.yaml
kubectl apply -f service.yaml
kubectl get pods -o wide
The app prints which pod served each request, so I can watch the load balancing happen:
for i in $(seq 1 6); do curl -s http://localhost:30080 | grep -o "Pod: [a-z0-9-]*"; done
The responses alternate between the two pods. Every other request, I am being served by a machine in a different region, and the only way to tell is by reading the hostname.
Chapter 6: Killing a Pod to Prove It Heals
A claim like “Kubernetes self-heals” is worth nothing until you watch it happen. So I tested it the most direct way possible: I deleted a running pod and watched what the system did.
# Note a running pod, then delete it
kubectl get pods -o wide
kubectl delete pod <pod-name>

# Watch the cluster react in real time
kubectl get pods -o wide -w
Within seconds, two things happened automatically. The Service stopped routing traffic to the deleted pod, so requests kept being served with no failures — by the surviving pod on the other node. And the Deployment noticed that reality (one pod) no longer matched the desired state (two pods), so it created a replacement and scheduled it back onto the node that had just lost one, honoring the same one-pod-per-node spread constraint.
I did not restart anything. I did not SSH anywhere. I did not run a recovery script. I deleted a pod and the system repaired itself in under a minute.
That is the entire value proposition of Kubernetes, demonstrated on my own hardware across two regions. Not speed, not splitting work across machines — resilience. The system notices failure and corrects it without me.
Chapter 7: The Blind Spot — My Monitoring Could Not See My Own Outage
Partway through this work, while thinking about how the cluster behaves when a node goes offline, I realized something uncomfortable about my monitoring.
All of my monitoring — Prometheus, the alerting, the log analysis — runs on the control-plane machine. It monitors that machine and the services around it. But if that machine loses internet, the very system that would alert me is the system that just went offline. The watchman is locked inside the building he is supposed to be watching. I would get no alert at the moment of failure — only a backlog of alerts later, once connectivity returned, by which point I already knew something had gone wrong.
This is a classic monitoring anti-pattern: you cannot reliably monitor a system from inside that system. The fix is out-of-band monitoring — a watcher that lives somewhere else, observing your primary site from the outside.
I already had the perfect place for it: the cloud worker, with its own independent internet connection. I put a small watcher there that checks the control plane’s status page over the mesh on a schedule. The logic is inverted from normal monitoring: instead of the control plane reporting “I am fine” and going silent when it is not, silence from the control plane becomes the alert, detected by an outside observer.
Here is the watcher, genericized. It tracks state across runs so it alerts only on transitions, and requires two consecutive failures so a momentary blip does not cry wolf:
#!/bin/bash
# External watchdog — runs on the cloud worker, watches the control plane.

PRIMARY_URL="http://<CONTROL_PLANE_IP>:30080"
STATE_FILE="$HOME/.watcher_state"
FAIL_FILE="$HOME/.watcher_fails"
TIMEOUT=5
FAIL_THRESHOLD=2

# Webhook loaded from a locked-down env file, never hardcoded
source "$HOME/.watcher_env"

send() {
  curl -s -H "Content-Type: application/json" -X POST \
    -d "{\"content\": \"$1\"}" "$DISCORD_WEBHOOK_URL" > /dev/null
}

PREV_STATE=$( [ -f "$STATE_FILE" ] && cat "$STATE_FILE" || echo "UP" )
FAIL_COUNT=$( [ -f "$FAIL_FILE" ] && cat "$FAIL_FILE" || echo 0 )

HTTP_CODE=$(curl -s --connect-timeout $TIMEOUT -o /dev/null -w "%{http_code}" "$PRIMARY_URL")

if [ "$HTTP_CODE" = "200" ]; then
  echo 0 > "$FAIL_FILE"
  if [ "$PREV_STATE" = "DOWN" ]; then
    send "primary is BACK ONLINE — reachable again. $(date)"
    echo "UP" > "$STATE_FILE"
  fi
else
  FAIL_COUNT=$((FAIL_COUNT + 1))
  echo "$FAIL_COUNT" > "$FAIL_FILE"
  if [ "$FAIL_COUNT" -ge "$FAIL_THRESHOLD" ] && [ "$PREV_STATE" = "UP" ]; then
    send "primary is UNREACHABLE — $FAIL_COUNT consecutive failures. HTTP $HTTP_CODE — $(date)"
    echo "DOWN" > "$STATE_FILE"
  fi
fi
The webhook URL lives in a separate file with locked-down permissions, never in the script and never in git:
echo 'DISCORD_WEBHOOK_URL="https://discord.com/api/webhooks/..."' > ~/.watcher_env
chmod 600 ~/.watcher_env
Schedule it every two minutes with cron:
crontab -e
# */2 * * * * /bin/bash $HOME/watcher.sh >> $HOME/watcher.log 2>&1
I tested the whole loop by taking the status page down and watching the alert fire from the external node, then bringing it back and watching the recovery alert. Both directions worked.
The thing I am proudest of in this whole project is not the cluster. It is noticing this flaw at all. Realizing “my monitoring runs on the thing it monitors, so an outage means silence” is the kind of thinking that separates setting up infrastructure from actually operating it.
What I Took Away From This
Part 1 taught me delivery. Part 2 taught me provisioning. Part 3 taught me what it means to run something that is supposed to stay up.
The technical wins were real — a working two-region cluster, a multi-architecture image, demonstrated self-healing. But the parts that will stay with me are the judgment calls. Recognizing that a green “Ready” status was hiding a broken network. Deciding to solve the architecture mismatch the right way with a multi-arch build instead of just pinning the app to one node. Catching the monitoring blind spot before it caught me.
There is also a discipline thread running through all of this that comes straight from my day job in pharmaceutical manufacturing, where you do not get to assume a system works because it started — you verify the behavior you actually care about, every time. I killed a pod to confirm healing. I curled across nodes to confirm networking. I took the status page down to confirm the alert fired. Testing the failure case, not just the happy path, is the same instinct in both worlds.
I also made a point of keeping the portfolio honest. My monitoring scrapes metrics from nodes in three locations into a single Prometheus — that is real and live, and I describe it as exactly that: centralized multi-node scraping, not “federation,” which is a different and more complex architecture I have not built. If a claim cannot survive a follow-up question, it does not belong on the page.
What is Next?
Part 4 is about seeing everything from the outside. The cluster runs, the metrics flow into Grafana, and the external watchdog covers the worst-case blind spot. The next layer is true external uptime monitoring — probing my public endpoints from a third location entirely, so I measure availability the way a real visitor experiences it, not the way my own infrastructure reports it.
Alongside that, the manual image-distribution crutch from Chapter 4 gets replaced with a proper container registry, so deploying a new version becomes a push instead of a file copy — which in turn sets up the final piece: application deployments driven by Git, the same GitOps discipline from Part 2 extended from infrastructure to the workloads running on top of it.
The layers are starting to converge. The pipeline from Part 1 builds the images. The Terraform from Part 2 provisions the nodes. The Kubernetes from Part 3 runs the workloads and keeps them alive. What is left is closing the loop between them.
Stay tuned, and happy building.
Appendix: The Complete Manifests
For reference, the full set of files for the status-page workload.
deployment.yaml
apiVersion: apps/v1
kind: Deployment
metadata:
  name: status-page
  labels:
    app: status-page
spec:
  replicas: 2
  selector:
    matchLabels:
      app: status-page
  template:
    metadata:
      labels:
        app: status-page
    spec:
      containers:
        - name: status-page
          image: status-page:v1
          imagePullPolicy: IfNotPresent
          ports:
            - containerPort: 5000
          livenessProbe:
            httpGet:
              path: /health
              port: 5000
            initialDelaySeconds: 10
            periodSeconds: 30
          readinessProbe:
            httpGet:
              path: /health
              port: 5000
            initialDelaySeconds: 5
            periodSeconds: 10
          resources:
            requests:
              memory: "64Mi"
              cpu: "50m"
            limits:
              memory: "128Mi"
              cpu: "200m"
      topologySpreadConstraints:
        - maxSkew: 1
          topologyKey: kubernetes.io/hostname
          whenUnsatisfiable: DoNotSchedule
          labelSelector:
            matchLabels:
              app: status-page
service.yaml
apiVersion: v1
kind: Service
metadata:
  name: status-page
  labels:
    app: status-page
spec:
  type: NodePort
  selector:
    app: status-page
  ports:
    - port: 80
      targetPort: 5000
      nodePort: 30080
Dockerfile
FROM python:3.11-slim
WORKDIR /app
COPY requirements.txt .
RUN pip install --no-cache-dir -r requirements.txt
COPY app.py .
EXPOSE 5000
CMD ["python", "app.py"]
The full source — Flask app, manifests, and a README explaining the multi-arch build and failover test — is on my GitHub as k3s-status-page.